Oceans of Data: The Great Pacific Garbage Patch
May 21, 2018
To shake things up for the week I plan on talking about pollution, specifically the ocean. There are people in today’s age that don’t understand how bad pollution and littering can be. Inevitably, they just can’t be bothered to take the extra minute to sort/throw away their waste properly. Whether it’s simply tossing out a cigarette filter on the ground, mixing up recycling in the trash, or illegal waste dumping, unfortunately a large portion of it accumulates in our ocean – which doesn’t have the ability to clean itself. According to a 2017 research article, 1.15 to 2.41 million tons of plastic are entering the ocean each year. More than half of this plastic will not sink once it encounters the sea, it will then float in the ocean endlessly until it is removed. Our massive oceans are amazing, they generate so much power with their relentless currents, they have hoarded trash into five huge garbage clusters. So, I’m guessing we all remember geography class and recall that our planet has five oceans and seven continents? Time to add one more mass to the list.
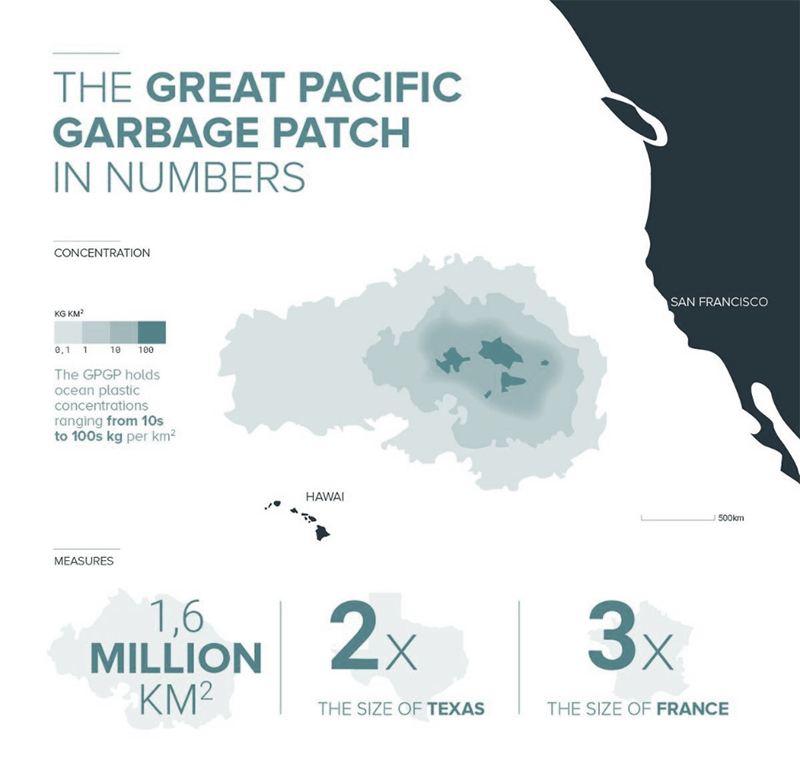
Introducing the Great Pacific Garbage Patch (GPGP), which covers an estimated 1.6 million square kilometers. It’s the largest of the five offshore plastic accumulation zones in the Earth’s oceans located halfway between Hawaii and California. The area of the GPGP is twice the size of Texas or three times the size of France. To formulate this number, a team of scientists used a fleet of 30 boats, 652 surface nets with two aerial imagery flights over the patch. Sampling at different locations within the same time allowed a more accurate estimate of the size of the patch and the plastic drifting in it. On average the patch orbits around 32°n and -145°w. However, scientists observed seasonal shift from West to East and substantial variations in latitude (North to South) depending on the time of year.

Most of the computational/mathematical processes used data methods to study the GPGP, allowing researchers to visualize and characterize many features of the patch and the plastic within it. When the manta trawls samples were captured and then brought on the vessel, several criteria were noted in the datasheets, including the date, duration, and final coordinates of each tow. With this information, the team was able to identify the exact location where the plastic was retrieved. The location and duration of all tows were confirmed during a post-processing phase by inspecting all the recorded datasheets against GPS trackers that were installed on all participating vessels. The total distance of tows, for example, combined with the net’s characteristics allowed the researchers to estimate the total surveyed surface.
Cluster analysis image modeling was used for a “pixel to kilogram calculation algorithm” to convert pixels into kilograms. Scientists used a swimming pool to find the correlation factor between top surface area and dry weight of large debris. By merging all the data into a comprehensive computer model, the data and imagery gathered from these objectives were eventually used by the scientists to build various models and computer-generated graphics. These served as a visual representation of the studies and tests that had been performed from the expeditions. Data Science of this nature is crucial when it comes to considering the overlooked facets of the GPGP – only with numbers we get statistics, only with statistics we obtain facts, and only with facts we can force actions.
Subscribe with us at Apex United Corporation to stay up to-date on the latest business and technology news.


